Liquid Analytics was developing a single app that could be adopted by all of their wholesale distributors. This app read in customer data, analyzed and presented the data for sales representatives to gain insights (e.g. how close they are to achieving their sales goals), and take actions based on this data to improve their metrics. The sales managers in these companies wanted to be able to gather qualitative information with surveys to their teams to gain a better understanding of the work and the needs of their teams - which in turn helped them set better goals for them as well.
Who I worked with: COO, CFO (acting product manager), and a web developer
DESIGN PROBLEM
As a part of the existing administrative web app allow sales managers to create and manage surveys from their desktop on the web, and add the ability for sales representatives to become aware of and take the surveys while using the existing iPad application.
I came into this project at a point where the COO had concrete requirements for the app. I knew from the beginning that we needed to develop a single web app that could be consumed on the web or mobile (embedded).
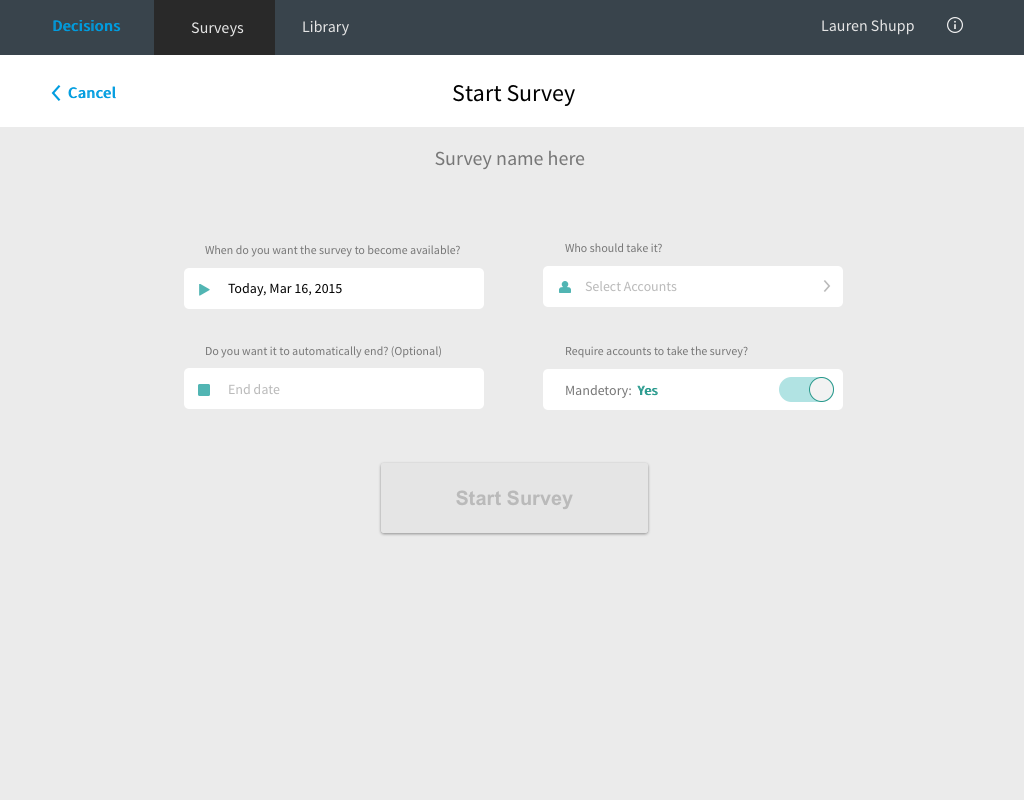
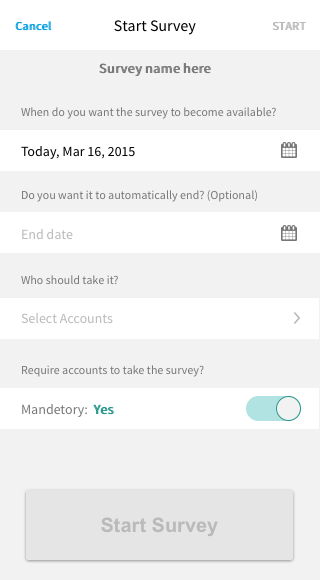
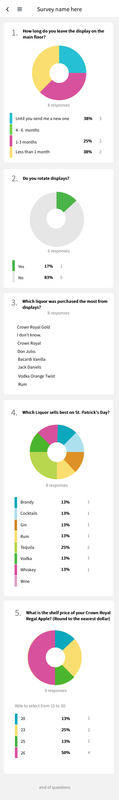
I went with a mobile-first approach, which led me to an adaptive design for the app
I increased adoption of the surveys by sales reps by allowing admins to target specific teams, allowing admins to schedule to specific sales cycles, and incorporating notifications in the iPad app.
I came up with a taxonomy for the surveys: running (published and out for consumption), drafts (still being edited), and stopped (stopped or expired). In helping sales managers identify the surveys, I show different information for each survey based on it's state. If it's running, when ill it end? If it's a draft, how many questions does it have so far? If it's stopped, when did it end an how long did it run for?
I also adopted different visual cues to help the eye scan the list and more easily catch states of interest. Rather than displaying 0% or 100%, I opted to show no value for 0% with an incomplete gray ring, and for surveys with full participation a completed blue ring with a check icon.
Flip through the slideshow to view all three views and see how each state is represented to reinforce and recall which set of surveys you're looking at.
Desktop
iPhone
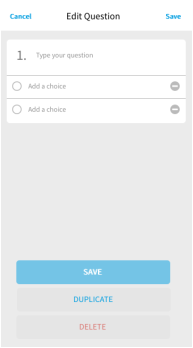
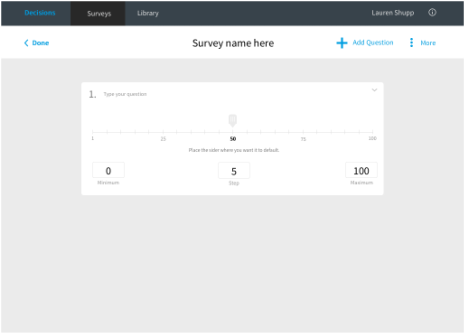
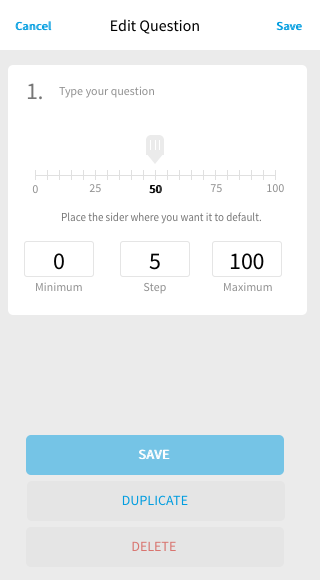
And of course I need to spec how each question type will work. I created design specs for questions like multiple choice pick one, multiple choice pick many, Yes / No, Sliders, and Comment boxes.
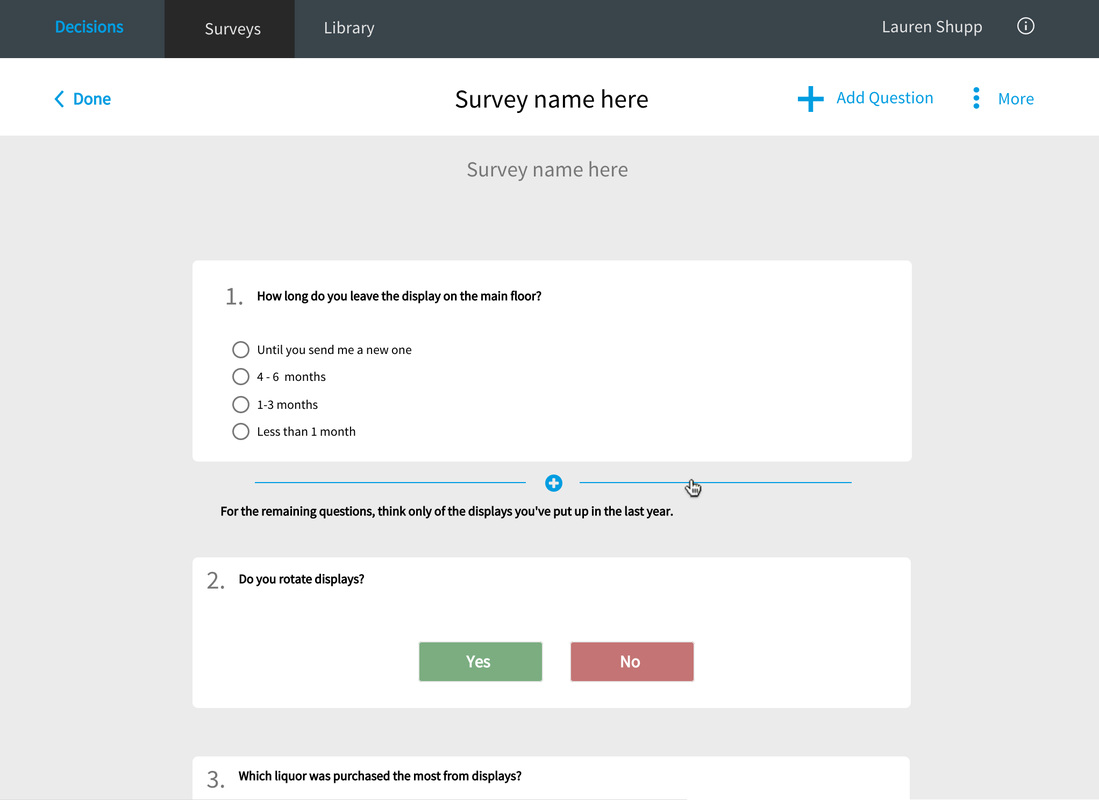
When editing questions for the survey, I included device specific interactions that can enhance the experience. For example, when we detect the desktop experience, take advantage of hover interactions.
I often work in smart defaults into the experience. For example, when the creator is ready to start the survey, I default the start date to today, assuming you want it live immediately. Otherwise, you can simple edit the field to postpone when it goes live.
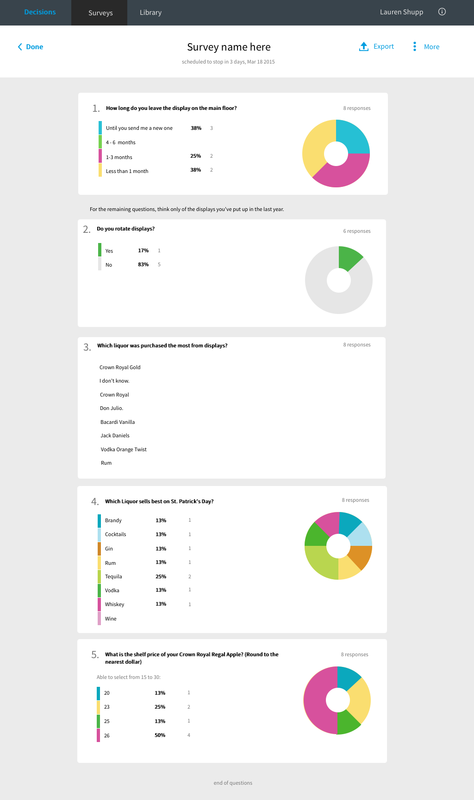
Once responses start rolling in, I designed views for analyzing the results for all question types. Showing the metrics in a useful, clean and consistent way was the challenge. Take for example the slider question. Technically it's just like a multiple choice question (e.g. question 4), where you are picking one out of many. But, who wants to hunt for the responses in such a long list of values in the range? For this type, I hide from the list values not chosen by any respondent, only showing actual responses (e.g. question 5).